
187 lines
8.0 KiB
Markdown
187 lines
8.0 KiB
Markdown
# Forecast the usage of a GitLab namespace
|
|
In this lab we will use the `forecast` command to forecast potential GitHub Actions usage by computing metrics from the historical pipeline data in our GitLab instance. The metrics will be stored on disk in a markdown file and include job metrics for execution time, queue time, and concurrency. We will look at each of these metrics in more depth later in this lab.
|
|
|
|
- [Prerequisites](#prerequisites)
|
|
- [Prepare for forecast](#prepare-for-forecast)
|
|
- [Perform a forecast](#perform-a-forecast)
|
|
- [Review forecast report](#review-forecast-report)
|
|
- [Review additional files](#review-additional-files)
|
|
- [Forecasting multiple providers](#forecasting-multiple-providers)
|
|
- [Next steps](#next-steps)
|
|
|
|
## Prerequisites
|
|
|
|
1. Followed [steps](../gitlab#readme) to set up your codespace environment.
|
|
2. Completed the [configure lab](../gitlab/valet-configure-lab.md).
|
|
3. Ran the setup script in the terminal to make sure the GitLab instance is ready.
|
|
```
|
|
source gitlab/bootstrap/setup.sh
|
|
```
|
|
|
|
## Prepare for forecast
|
|
Before we can run the forecast we need to answer a few questions so we can construct the correct command.
|
|
1) What namespace do we want to run the forecast for? __valet. This is the only group in the demo GitLab instance.__
|
|
2) What is the date we want to start forecasting from? __2022-08-02. This date is before the time the data was populated on our demo GitLab instance. In practice, this should be a date that will give you enough data to get a good understanding of the typical usage. Too little data and the metrics might not give an accurate picture__
|
|
3) Where do we want to store the results? __./tmp/forecast_reports. This can be any valid path on the system, but for simplicity it is recommend to use a directory in the root of the codespace workspace.__
|
|
|
|
## Perform a forecast
|
|
- Using the answers above we get the following `forecast` command:
|
|
```
|
|
gh valet forecast gitlab --output-dir ./tmp/forecast_reports --namespace valet --start-date 2022-08-02
|
|
```
|
|
- Run the command in the codespace terminal.
|
|
- Verify that the command output is similar to this.
|
|

|
|
|
|
## Review forecast report
|
|
Open the forecast report and review the calculated metrics.
|
|
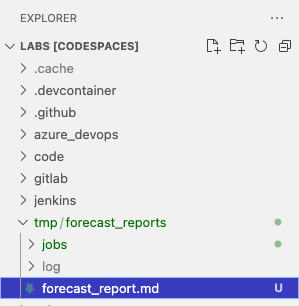
- From the codespace explorer pane find `./tmp/forecast_reports/forecast_report.md` and right-click, and select __Open Preview__.
|
|
|
|
- The file should be similar to this.
|
|
<details>
|
|
<summary>example forecast_report.md</summary>
|
|
|
|
# Forecast report for [GitLab](http://localhost/valet)
|
|
|
|
- Valet version: **0.1.0.13432(03b5bc9370a8f0073c0cc1a4b25f6b81d0005c0f)**
|
|
- Performed at: **8/17/22 at 20:00**
|
|
- Date range: **2/8/22 - 8/17/22**
|
|
|
|
## Total
|
|
|
|
- Job count: **57**
|
|
- Pipeline count: **15**
|
|
|
|
- Execution time
|
|
|
|
- Total: **135 minutes**
|
|
- Median: **0 minutes**
|
|
- P90: **7 minutes**
|
|
- Min: **0 minutes**
|
|
- Max: **10 minutes**
|
|
|
|
- Queue time
|
|
|
|
- Median: **0 minutes**
|
|
- P90: **5 minutes**
|
|
- Min: **0 minutes**
|
|
- Max: **42 minutes**
|
|
|
|
- Concurrent jobs
|
|
|
|
- Median: **0**
|
|
- P90: **0**
|
|
- Min: **0**
|
|
- Max: **9**
|
|
|
|
---
|
|
|
|
## gitlab-runner
|
|
|
|
- Job count: **57**
|
|
- Pipeline count: **15**
|
|
|
|
- Execution time
|
|
|
|
- Total: **135 minutes**
|
|
- Median: **0 minutes**
|
|
- P90: **7 minutes**
|
|
- Min: **0 minutes**
|
|
- Max: **10 minutes**
|
|
|
|
- Queue time
|
|
|
|
- Median: **0 minutes**
|
|
- P90: **5 minutes**
|
|
- Min: **0 minutes**
|
|
- Max: **42 minutes**
|
|
|
|
- Concurrent jobs
|
|
|
|
- Median: **0**
|
|
- P90: **0**
|
|
- Min: **0**
|
|
- Max: **9**
|
|
|
|
> Note: Concurrent jobs are calculated by using a sliding window of 1m 0s.
|
|
|
|
</details>
|
|
|
|
### Metric Definitions
|
|
| Name | Description |
|
|
| ----- | ----------- |
|
|
| Median | The __middle__ value |
|
|
| P90 | 90% of the values are less than or equal to |
|
|
| Min | The lowest value |
|
|
| Max | The highest value |
|
|
|
|
### Total Section
|
|
- This section shows the metrics for all of the jobs run in projects contained in the `valet` namespace, from 08/02/2022 to the time the command was executed.
|
|
## Total
|
|
|
|
- Job count: **57**
|
|
- Pipeline count: **15**
|
|
---
|
|
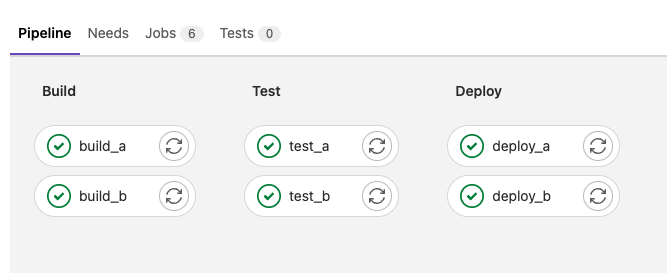
We can see we ran 15 pipelines that contained 57 jobs. The number of jobs is expected to be larger than pipelines because a pipeline is typically a collection of jobs. For example `basic-pipeline-example` contains 6 jobs
|
|
|
|
|
|
- `Execution time` shows the metrics for the time a job __took to run__. Looking closer we can see during our forecast timeframe the total job run time was 135 minutes with 90% of the jobs finishing under 7 minutes, and the longest job taking 10 minutes. The `min` is 0 because the quickest job took less than a minute and was rounded down to 0.
|
|
- Execution time
|
|
- Total: **135 minutes**
|
|
- Median: **0 minutes**
|
|
- P90: **7 minutes**
|
|
- Min: **0 minutes**
|
|
- Max: **10 minutes**
|
|
|
|
- `Queue time` shows the metrics for how long jobs __waited__ for a runner to be available.
|
|
- Queue time
|
|
- Median: **0 minutes**
|
|
- P90: **5 minutes**
|
|
- Min: **0 minutes**
|
|
- Max: **42 minutes**
|
|
- `Concurrent jobs` show the metrics for how many jobs were run at the __same time__.
|
|
- Concurrent jobs
|
|
- Median: **0**
|
|
- P90: **0**
|
|
- Min: **0**
|
|
- Max: **9**
|
|
### Runner Group Sections
|
|
- The preceding section shows the same metrics as the `Total` section, but are grouped by runner group. A runner group is a machine (or group of machines) that each job runs on
|
|
- In this case we only have one runner group `gitlab-runner` so the metrics match the `Total` section. If there were different groups we could possibly identify runner types that needed to be increased or decreased when moving to GitHub Actions
|
|
## gitlab-runner
|
|
|
|
- Job count: **57**
|
|
- Pipeline count: **15**
|
|
|
|
- Execution time
|
|
- Total: **135 minutes**
|
|
- Median: **0 minutes**
|
|
- P90: **7 minutes**
|
|
- Min: **0 minutes**
|
|
- Max: **10 minutes**
|
|
|
|
- Queue time
|
|
- Median: **0 minutes**
|
|
- P90: **5 minutes**
|
|
- Min: **0 minutes**
|
|
- Max: **42 minutes**
|
|
|
|
- Concurrent jobs
|
|
- Median: **0**
|
|
- P90: **0**
|
|
- Min: **0**
|
|
- Max: **9**
|
|
|
|
## Forecasting multiple providers
|
|
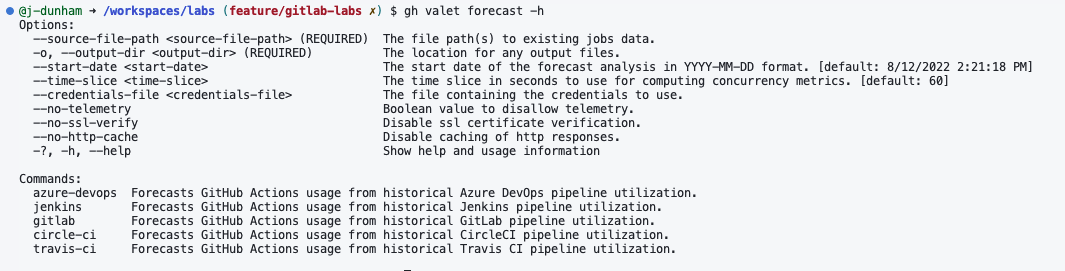
If we examine the help for the `forecast` command by running `gh valet forecast --help` we can see a new option `--source-file-path`
|
|
|
|
|
|
|
|
Using `--source-file-path` we can combine data from multiple forecast runs into a single report. This becomes useful if we are using multiple CI/CD providers, such as GitLab and Jenkins, and wanted to get a holistic view of the runner usage across the providers. The way this works is the forecast command creates a `.json` file in a `jobs` directory for each command execution. The `--source-file-path` takes a space-delimited list of data file paths or a glob pattern that will match all of the data files we want to include and combine into a single report. We will use a glob pattern, which in general should match `OUTPUT_DIR/**/jobs/*.json` where the `OUTPUT_DIR` is the previous value used for `--output-dir`, which in this lab was `./tmp/forecast_reports`. We do not have multiple providers but we can still try it out because we have a data file at `tmp/forecast_reports/jobs/`!
|
|
- run `gh valet forecast --source-file-path tmp/**/jobs/*.json -o tmp/combined-forecast`
|
|
- Now we have a new report that was generated from all the data files that matched the glob pattern. Note this command does not introspect the CI/CD provider, it only operates on the data files it finds.
|
|

|
|
|
|
## Next steps
|
|
[Migrating a GitLab Pipeline](../gitlab/6-migrate.md)
|