
187 lines
8.1 KiB
Markdown
187 lines
8.1 KiB
Markdown
# Forecast the usage of a GitLab namespace
|
|
In this lab we will use the `forecast` command to forecast potential GitHub Actions usage by computing metrics from the historical pipeline data in our GitLab instance. The metrics will be stored on disk in a markdown file and include job metrics for execution time, queue time, and concurrency. We will look at each of these metrics in more depth later in this lab.
|
|
|
|
- [Prerequisites](#prerequisites)
|
|
- [Prepare for forecast](#prepare-for-forecast)
|
|
- [Perform a forecast](#perform-a-forecast)
|
|
- [Review forecast report](#review-forecast-report)
|
|
- [Review additional files](#review-additional-files)
|
|
- [Forecasting multiple providers](#forecasting-multiple-providers)
|
|
- [Next steps](#next-steps)
|
|
|
|
## Prerequisites
|
|
|
|
1. Followed [steps](../gitlab#readme) to set up your codespace environment.
|
|
2. Completed the [configure lab](../gitlab/valet-configure-lab.md).
|
|
3. Ran the setup script in the terminal to make sure the GitLab instance is ready.
|
|
```
|
|
source gitlab/bootstrap/setup.sh
|
|
```
|
|
|
|
## Prepare for forecast
|
|
Before we can run the forecast we need to answer a few questions so we can construct the correct command.
|
|
1) What namespace do we want to run the forecast for? __valet. This is the only group in the demo GitLab instance.__
|
|
2) What is the date we want to start forecasting from? __2022-08-02. This date is before the time the data was populated on our demo GitLab instance. In practice, this should be a date that will give you enough data to get a good understanding of the typical usage. Too little data and the metrics might not give an accurate picture__
|
|
3) Where do we want to store the results? __./tmp/forecast_reports. This can be any valid path on the system, but for simplicity it is recommend to use a directory in the root of the codespace workspace.__
|
|
|
|
## Perform a forecast
|
|
- Using the answers above we get the following `forecast` command:
|
|
```
|
|
gh valet forecast gitlab --output-dir ./tmp/forecast_reports --namespace valet --start-date 2022-08-02
|
|
```
|
|
- Run the command in the codespace terminal.
|
|
- Verify that the command output is similar to this.
|
|

|
|
|
|
## Review forecast report
|
|
Open the forecast report and review the calculated metrics.
|
|
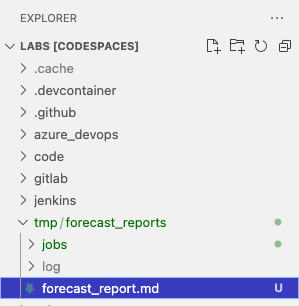
- From the codespace explorer pane find `./tmp/forecast_reports/forecast_report.md` and right-click, and select __Open Preview__.
|
|
|
|
- The file should be similar to this.
|
|
<details>
|
|
<summary>example forecast_report.md</summary>
|
|
|
|
# Forecast report for [GitLab](http://localhost/valet)
|
|
|
|
- Valet version: **0.1.0.13432(03b5bc9370a8f0073c0cc1a4b25f6b81d0005c0f)**
|
|
- Performed at: **8/17/22 at 20:00**
|
|
- Date range: **2/8/22 - 8/17/22**
|
|
|
|
## Total
|
|
|
|
- Job count: **57**
|
|
- Pipeline count: **15**
|
|
|
|
- Execution time
|
|
|
|
- Total: **135 minutes**
|
|
- Median: **0 minutes**
|
|
- P90: **7 minutes**
|
|
- Min: **0 minutes**
|
|
- Max: **10 minutes**
|
|
|
|
- Queue time
|
|
|
|
- Median: **0 minutes**
|
|
- P90: **5 minutes**
|
|
- Min: **0 minutes**
|
|
- Max: **42 minutes**
|
|
|
|
- Concurrent jobs
|
|
|
|
- Median: **0**
|
|
- P90: **0**
|
|
- Min: **0**
|
|
- Max: **9**
|
|
|
|
---
|
|
|
|
## gitlab-runner
|
|
|
|
- Job count: **57**
|
|
- Pipeline count: **15**
|
|
|
|
- Execution time
|
|
|
|
- Total: **135 minutes**
|
|
- Median: **0 minutes**
|
|
- P90: **7 minutes**
|
|
- Min: **0 minutes**
|
|
- Max: **10 minutes**
|
|
|
|
- Queue time
|
|
|
|
- Median: **0 minutes**
|
|
- P90: **5 minutes**
|
|
- Min: **0 minutes**
|
|
- Max: **42 minutes**
|
|
|
|
- Concurrent jobs
|
|
|
|
- Median: **0**
|
|
- P90: **0**
|
|
- Min: **0**
|
|
- Max: **9**
|
|
|
|
> Note: Concurrent jobs are calculated by using a sliding window of 1m 0s.
|
|
|
|
</details>
|
|
|
|
### Metric Definitions
|
|
| Name | Description |
|
|
| ----- | ----------- |
|
|
| Median | The __middle__ value |
|
|
| P90 | 90% of the values are less than or equal to |
|
|
| Min | The lowest value |
|
|
| Max | The highest value |
|
|
|
|
### Total Section
|
|
- This section shows the metrics for all of the jobs run in projects contained in the `valet` namespace, from 08/02/2022 to the time the command was executed.
|
|
## Total
|
|
|
|
- Job count: **57**
|
|
- Pipeline count: **15**
|
|
---
|
|
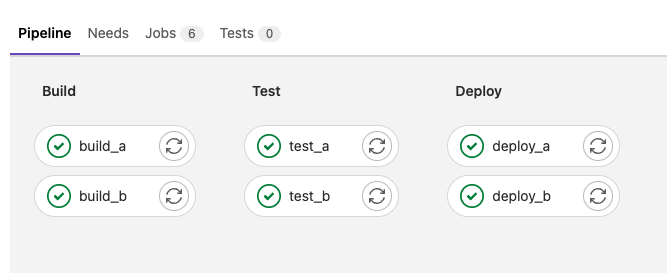
We can see we ran 15 pipelines that contained 57 jobs. The number of jobs is expected to be larger than pipelines because a pipeline is typically a collection of jobs. For example `basic-pipeline-example` contains 6 jobs
|
|
|
|
|
|
- `Execution time` shows the metrics for the time a job __took to run__. Looking closer we can see during our forecast timeframe the total job run time was 135 minutes with 90% of the jobs finishing under 7 minutes, and the longest job taking 10 minutes. The `min` is 0 because the quickest job took less than a minute and was rounded down to 0.
|
|
- Execution time
|
|
- Total: **135 minutes**
|
|
- Median: **0 minutes**
|
|
- P90: **7 minutes**
|
|
- Min: **0 minutes**
|
|
- Max: **10 minutes**
|
|
|
|
- `Queue time` shows the metrics for how long jobs __waited__ for a runner to be available.
|
|
- Queue time
|
|
- Median: **0 minutes**
|
|
- P90: **5 minutes**
|
|
- Min: **0 minutes**
|
|
- Max: **42 minutes**
|
|
- `Concurrent jobs` show the metrics for how many jobs were run at the __same time__.
|
|
- Concurrent jobs
|
|
- Median: **0**
|
|
- P90: **0**
|
|
- Min: **0**
|
|
- Max: **9**
|
|
### Runner Group Sections
|
|
- The preceding section shows the same metrics as the `Total` section, but are grouped by runner group. A runner group is a machine (or group of machines) that each job runs on
|
|
- In this case we only have one runner group `gitlab-runner` so the metrics match the `Total` section. If there were different groups we could possibly identify runner types that needed to be increased or decreased when moving to GitHub Actions
|
|
## gitlab-runner
|
|
|
|
- Job count: **57**
|
|
- Pipeline count: **15**
|
|
|
|
- Execution time
|
|
- Total: **135 minutes**
|
|
- Median: **0 minutes**
|
|
- P90: **7 minutes**
|
|
- Min: **0 minutes**
|
|
- Max: **10 minutes**
|
|
|
|
- Queue time
|
|
- Median: **0 minutes**
|
|
- P90: **5 minutes**
|
|
- Min: **0 minutes**
|
|
- Max: **42 minutes**
|
|
|
|
- Concurrent jobs
|
|
- Median: **0**
|
|
- P90: **0**
|
|
- Min: **0**
|
|
- Max: **9**
|
|
|
|
## Forecasting multiple providers
|
|
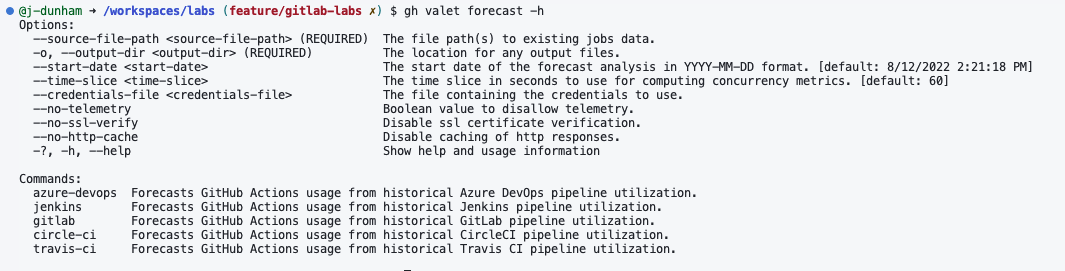
If we examine the help for the `forecast` command by running `gh valet forecast --help` we can see a new option `--source-file-path`
|
|
|
|
|
|
|
|
Using `--source-file-path` we can combine data from multiple forecast runs into a single report. This becomes useful if we are using multiple CI/CD providers, such as GitLab and Jenkins, and wanted to get a holistic view of the runner usage across the providers. The way this works is the forecast command creates a `.json` file in a `jobs` directory for each command execution. The `--source-file-path` takes a glob pattern that will match all of the data files we want to include and combines them in a report. Most likely, the glob pattern will match `OUTPUT_DIR/**/jobs/*.json` where the `OUTPUT_DIR` is the value we used for `--output-dir`, which in this lab was `./tmp/forecast_reports`. We do not have multiple providers but we can still try it out because we have a data file at `tmp/forecast_reports/jobs/`!
|
|
- run `gh valet forecast --source-file-path tmp/**/jobs/*.json -o tmp/combined-forecast`
|
|
- Now we have a new report that was generated from all the data files that matched the glob pattern. Note this command does not introspect the CI/CD provider it only operates the data files.
|
|

|
|
|
|
## Next steps
|
|
This concludes the Valet labs for GitLab, if you are interested exploring the power of Valet more. You can leverage the demo GitLab Instance and modify and add new projects that more closely match your needs and try out the commands again!
|