
3.7 KiB
3.7 KiB
Forecast the usage of a GitLab namespace
In this lab we will us the forecast command to forecast potential GitHub Actions usage by computing metrics from historical pipeline data from the GitLab instance. The metrics will be stored on disk in a markdown file and include job metrics for execution time, queue time, and concurrency. We will look at each of these metrics in more depth later in this lab.
Prerequisites
- Followed steps to set up your codespace environment.
- Completed the configure lab.
- Ran the setup script in the terminal to make sure the GitLab instance is ready .
source gitlab/bootstrap/setup.sh
Prepare for forecast
Before we can run the forecast we need to answer a few questions so we can construct the correct command.
- What namespace do we want to run the forecast for? valet. This is the only group in the demo GitLab instance.
- What is the date we want to start forecasting from? 08-02-2022. This is around but before the time the data was populated on our demo GitLab instance.
- Where do we want to store the results? ./tmp/forecast_reports. This can be any valid path on the system, but for simplicity it is recommend to use a directory in the root of the codespace workspace.
Perform a forecast
- Construct the command using the values from the questions above, it should look like:
gh valet forecast gitlab --output-dir ./tmp/forecast_reports --namespace valet --start-date 08-02-2022
- Run the command in the codespace terminal.
- Verify that you command outputed a similar result.

Review forecast report
Lets open the forecast report and look at the calculated metrics.
-
From the codespace explorer pane find
./tmp/forecast_reports/forecast_report.mdand click to open.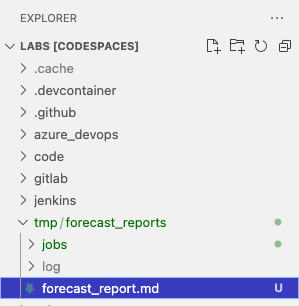
-
The file should be similar to this.
example forecast_report.md
# Forecast report for [GitLab](http://localhost/valet)

- Valet version: **0.1.0.13432(03b5bc9370a8f0073c0cc1a4b25f6b81d0005c0f)**
- Performed at: **8/17/22 at 20:00**
- Date range: **2/8/22 - 8/17/22**

## Total

- Job count: **57**
- Pipeline count: **15**

- Execution time

  - Total: **135 minutes**
  - Median: **0 minutes**
  - P90: **7 minutes**
  - Min: **0 minutes**
  - Max: **10 minutes**

- Queue time

  - Median: **0 minutes**
  - P90: **5 minutes**
  - Min: **0 minutes**
  - Max: **42 minutes**

- Concurrent jobs

  - Median: **0**
  - P90: **0**
  - Min: **0**
  - Max: **9**

---

## gitlab-runner

- Job count: **57**
- Pipeline count: **15**

- Execution time

  - Total: **135 minutes**
  - Median: **0 minutes**
  - P90: **7 minutes**
  - Min: **0 minutes**
  - Max: **10 minutes**

- Queue time

  - Median: **0 minutes**
  - P90: **5 minutes**
  - Min: **0 minutes**
  - Max: **42 minutes**

- Concurrent jobs

  - Median: **0**
  - P90: **0**
  - Min: **0**
  - Max: **9**

> Note: Concurrent jobs are calculated by using a sliding window of 1m 0s.
Metrics
Sections
Totalshows the metrics using all of the known runners.gitlab-runnershows the metrics for the runners in the gitlab-runner group, if there were other groups they would show here under their own group heading.